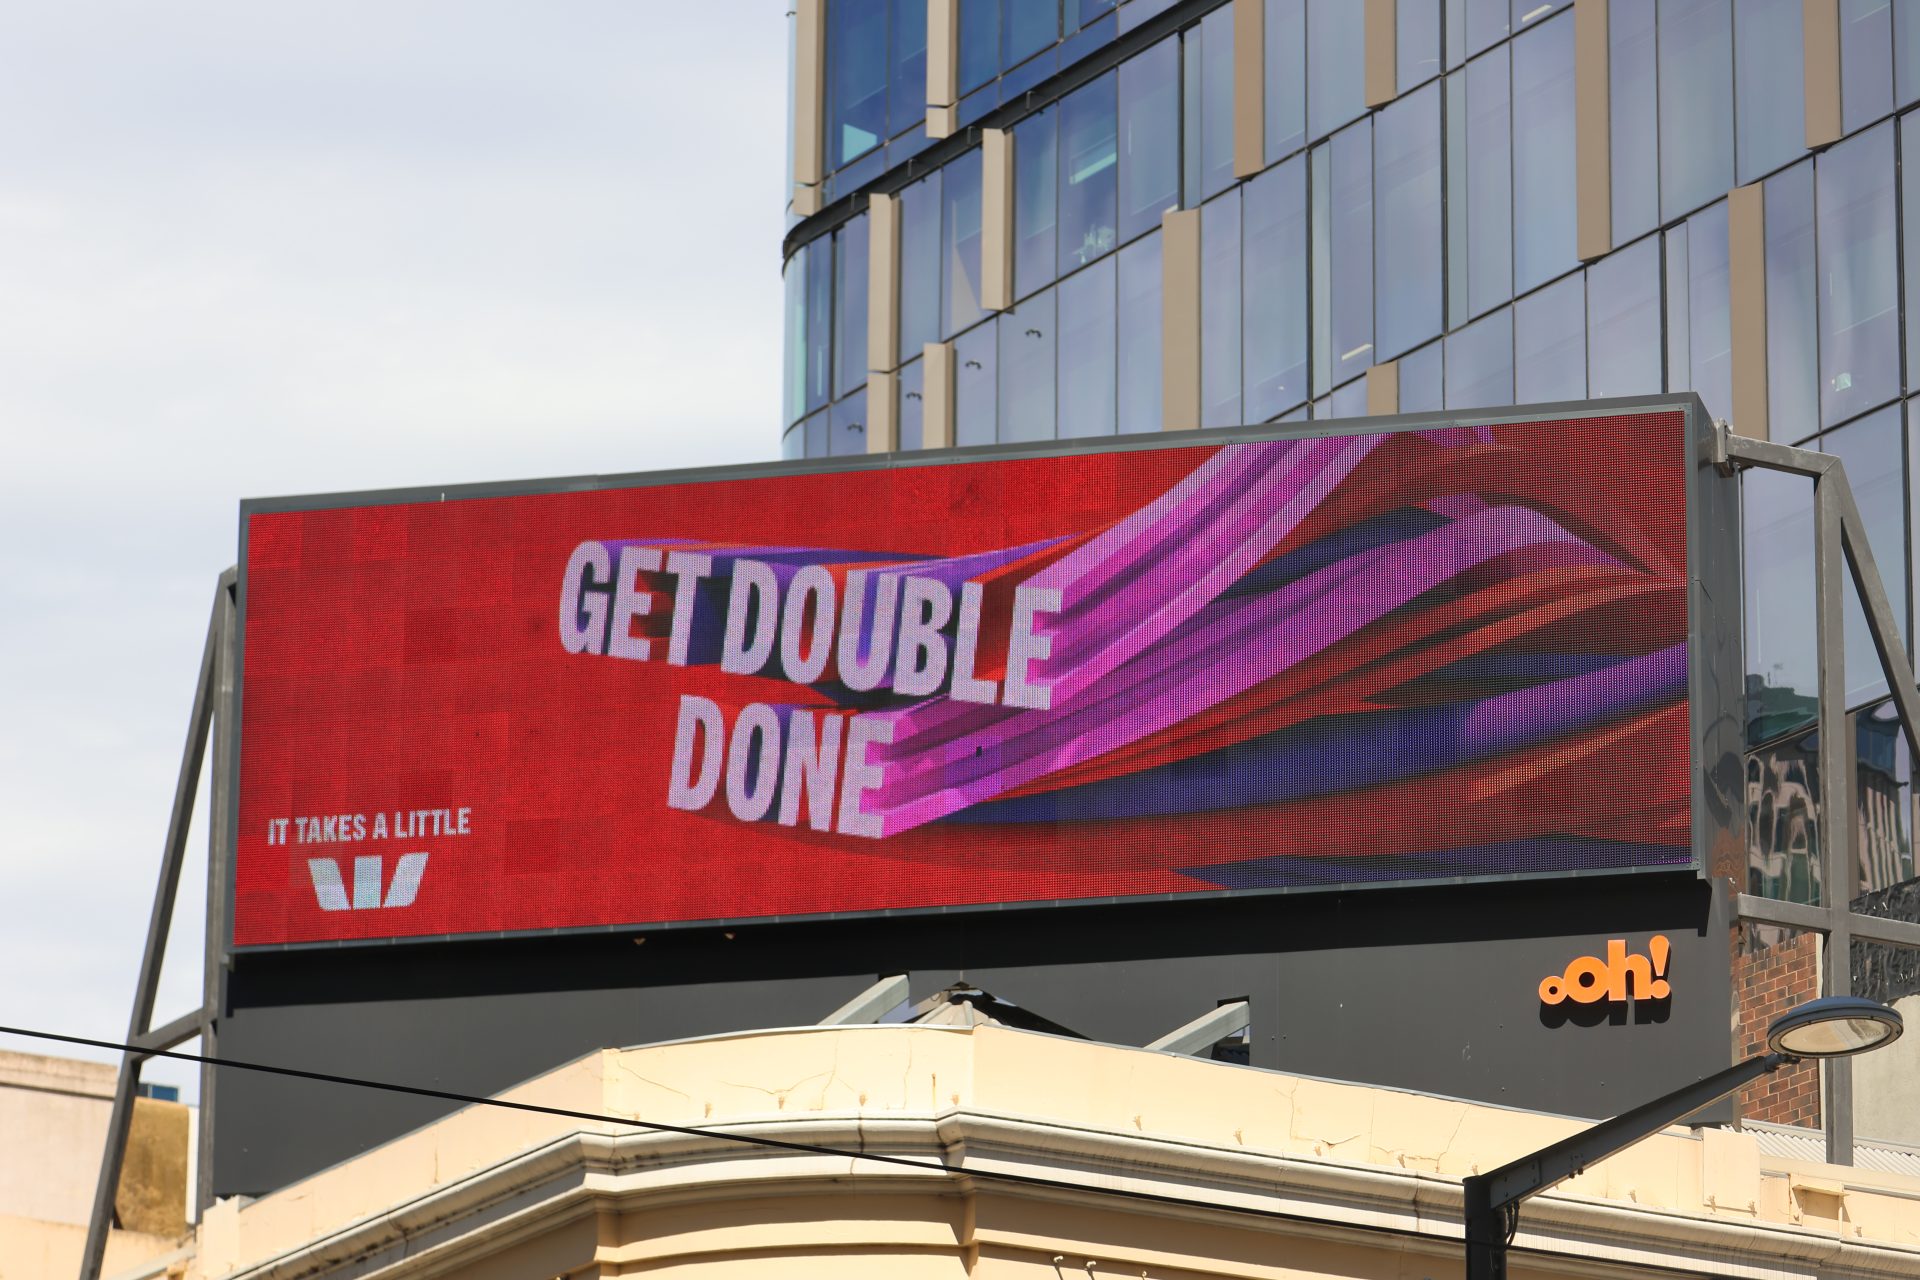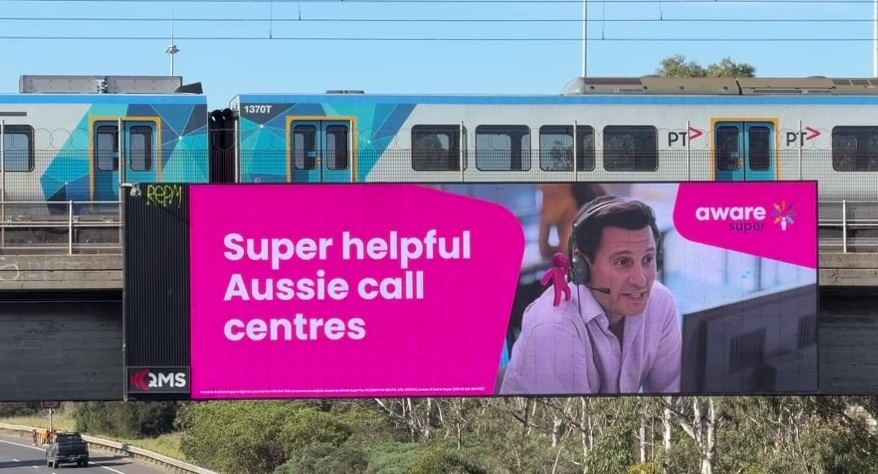
Superannuation advertising in Australia is changing shape, and the funds that track the data closely are best placed to respond. A small group of large funds shapes much of what Australians see in this category, so when budgets move, share of voice moves with them. Using Bigdatr‘s near real-time Advertising Creative and Media Value data, we analysed the industry to see where super fund money is going and how the media mix is shifting.
Superannuation advertising in Australia: spend dips 26.8% as funds pull back
Our Media Value data shows Q4 super ad spend totalled $50.8M, down $18.6M from $69.4M a year earlier. The slowdown was steady rather than sudden: April was already 25% below last year, and May saw the biggest drop, from $25.4M to $16.6M. Display drove the fall, down $8.7M (-38%), which accounts for almost half of the total decline.
What makes this more than a budget trim is where the money did not go. Our data shows 64% of the cuts came from advertisers who did not move the money into another channel. That points to an industry-wide pullback rather than funds simply swapping one channel for another, which is a useful distinction for any marketer benchmarking their own budget against the category.
Superannuation advertising leaders: two funds own more than a quarter
Industry funds ($34.5M) and retail funds ($7.3M) made up 82% of Q4 spend, so the story of superannuation advertising is largely the story of those two groups. At the top, Aware Super and AustralianSuper spent $10.6M in Q4, as much as the next three funds combined (Hostplus, Cbus and UniSuper), even though both trimmed spend year-on-year (-15% and -26% respectively).
The market is also concentrating. The top 10 advertisers contributed 70% of Q4 spend, up from 63% a year ago. As the total shrinks, the biggest names are holding more of what is left, which can make it harder for smaller funds to stay visible. Not everyone pulled back, though: 14 advertisers increased spend, led by Brighter Super and Commonwealth Bank.
Super fund media mix: digital leads, and Aware Super leans in
The super fund media mix is now firmly digital. Our data shows digital made up 59% of total media spend in Q4, led by Display (27.79%) and Search (16.32%), with TV at 16.74% and Out of Home at 13.2%. Digital holds that lead even though almost every major media type pulled back year-on-year. Display took the biggest hit, while Social held up best, down just 5% (from $4.0M to $3.8M) compared with -26% for Paid Search and -24% for TV.
Aware Super shows where things are heading. Our data shows it cut OOH by 70% and moved the budget into digital, with Paid Social rising from $206K to $1.8M, led by LinkedIn ($199K to $1.46M), and Reddit display growing from $4K to $709K. It is a clear example of a fund rebalancing from outdoor towards digital platforms.
The takeaway for marketers: spend is shrinking, the leaders are consolidating, and digital is where budgets are being rebuilt. Tracking competitor creative and channel mix in superannuation advertising closely matters more than ever, and it is exactly what Bigdatr‘s Advertising Creative and Media Value data is built to show.
Want a full picture? Download the full report: Superannuation Advertising, October 2026.
Note: Figures are correct at the time of publishing and are an indicative snapshot. Media Value data is continuously updated, so log in to your account for the latest numbers.
These insights come from Bigdatr, which combines near real-time Advertising Creative and Media Value data for 95,000+ brands across 13 key industries. You can uncover more insights on Australian advertising trends, top advertisers in Australia, competitor creative and share of voice. Start a free trial or contact us to see how Bigdatr can back your next ad-spend decision with real market data.
References
Bigdatr Australia, Media Value data.